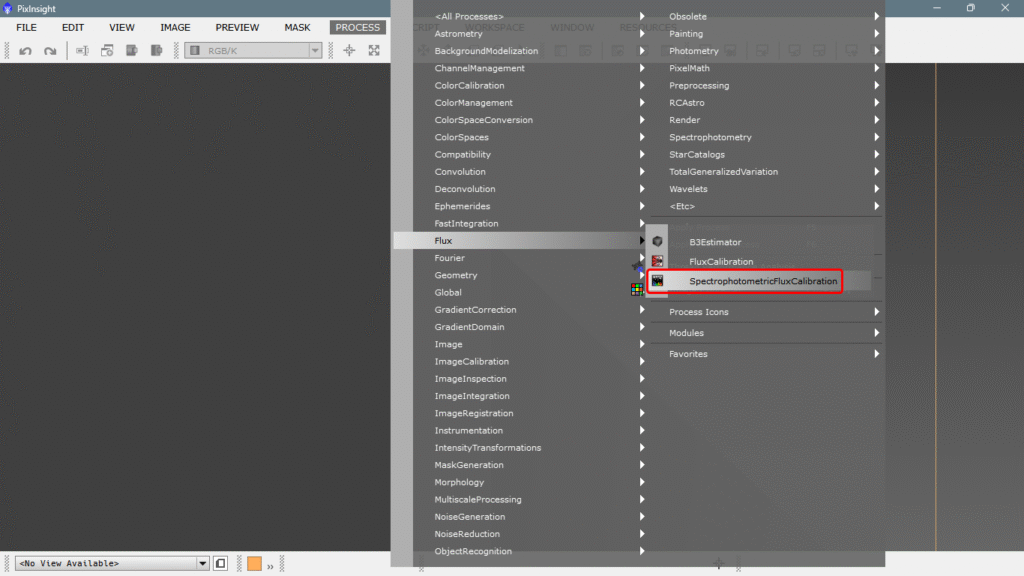
Spectrophotometric Flux Calibration
To use it, it is necessary to have the astrometric solution done.
SPFC is a PixInsight tool, different from SPCC (Spectrophotometric Color Calibration). It is used to calibrate the physical flux of the image, not the color, based on spectrophotometric data.
It generates an ordered flux data graph, which indicates that it is analyzing and calibrating real photometric flux measurements. It must be applied before stretching the image: many users do it after color correction and before final processing.
SPFC ignores narrowband unless it is checked, and it allows selecting filters such as Astronomik to calibrate the gray channel (Luminance). In the case of the gray channel, the “gray filter” is ignored if it’s RGB; for black and white images, it works with UV/IR block filters.
-Now let’s take a look at it graphically, here it is:
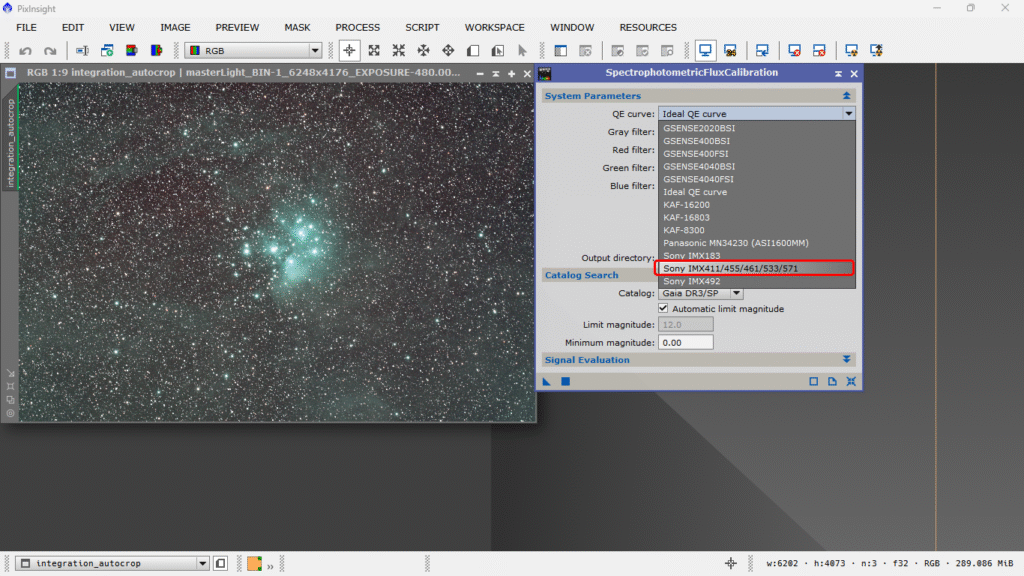
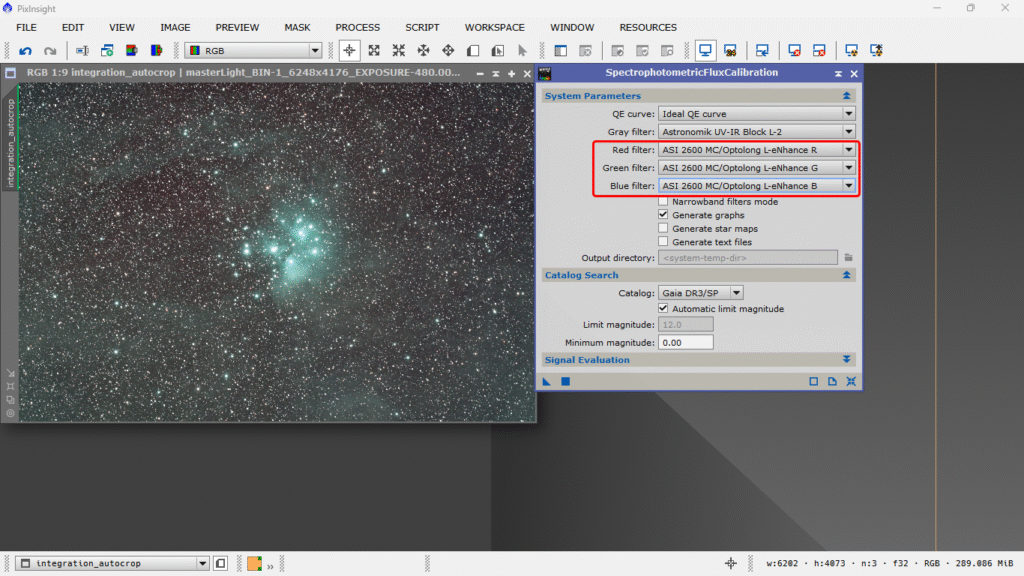
When we click, the configuration console appears, and the first dropdown QE curve offers us several sensor types; we’ll choose our camera’s sensor if it’s on the list, if not, we’ll simply leave Ideal QE curve. Since the picture was taken with an ASI 2600 MC, we’ll choose the Sony IMX 571 sensor.
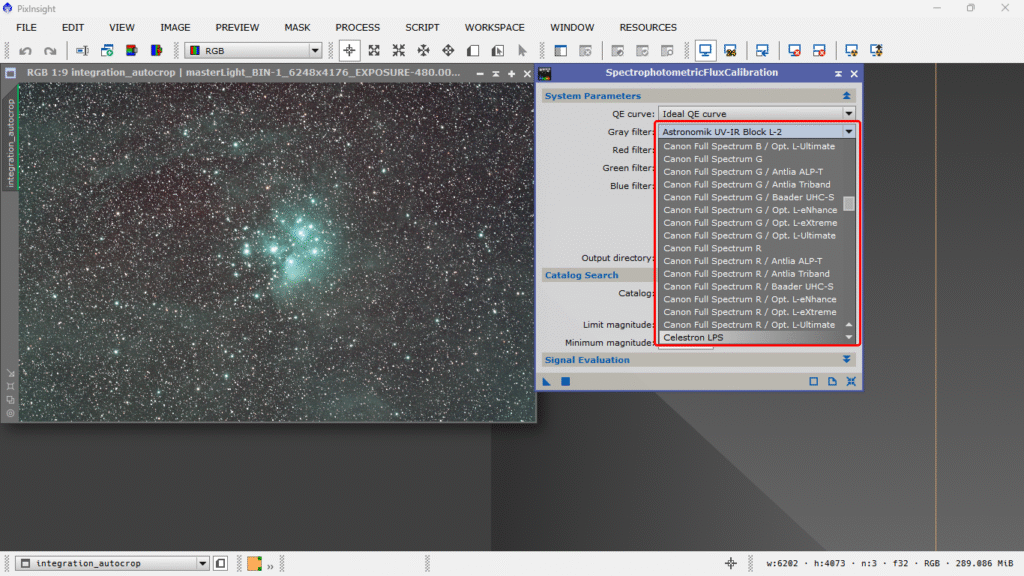
Next, we ignore the gray filter because we are using a color sensor—no matter what we select, the tool will ignore it. On the other hand, if we were using a monochrome camera, we would need to enter the filter used to capture the luminance or gray channel. There are plenty of filters to choose from, and we can also create our own combinations—as explained in the previous entry called «Customize camera/filter». LINK
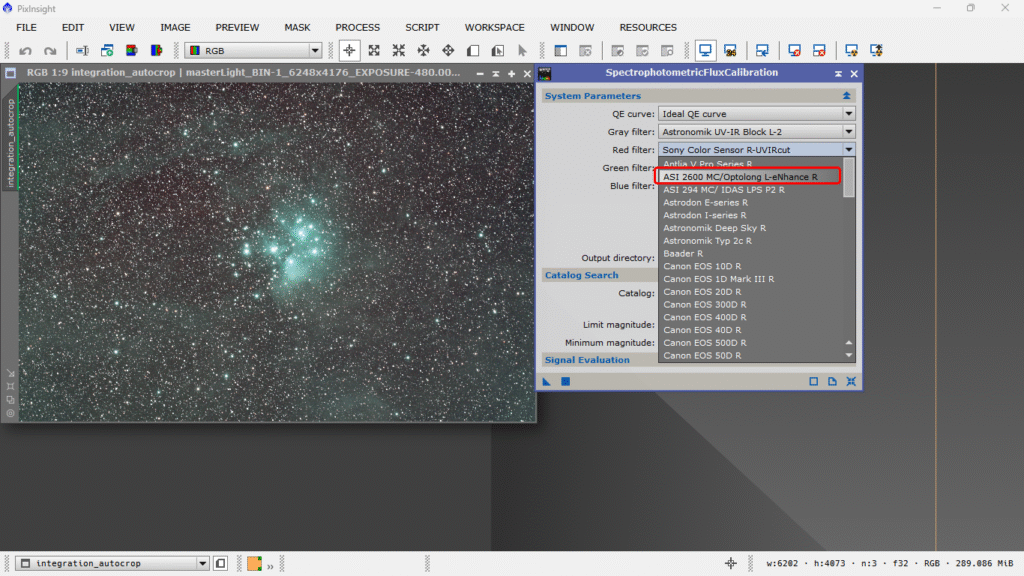
Now it’s the color channels’ turn, which can be the typical RGB or, if we’ve shot in narrowband, they can be the filters we used. Since I configured my camera with one of my filters using FILTER MANAGER, I choose that option, and I do the same for each channel.
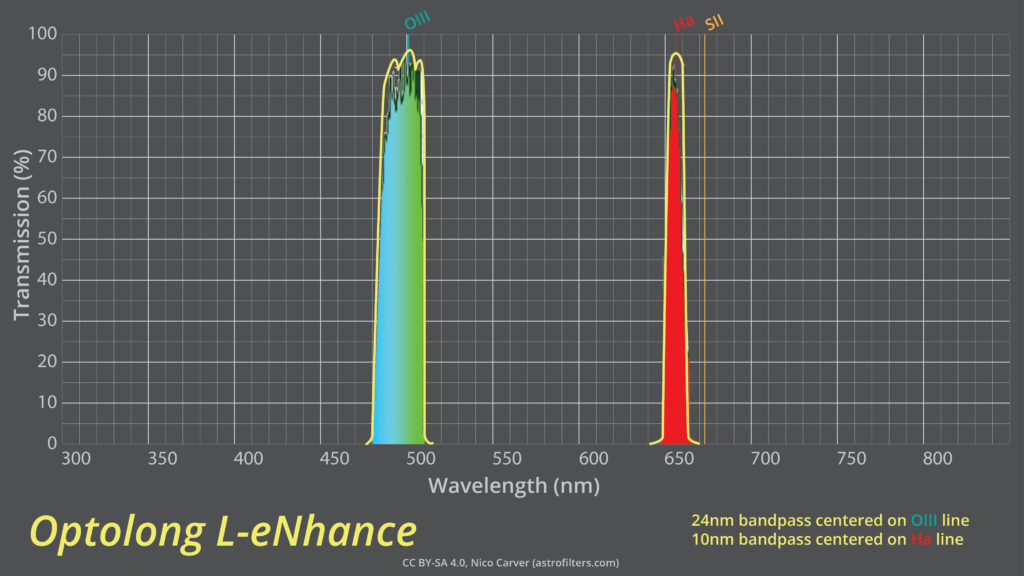
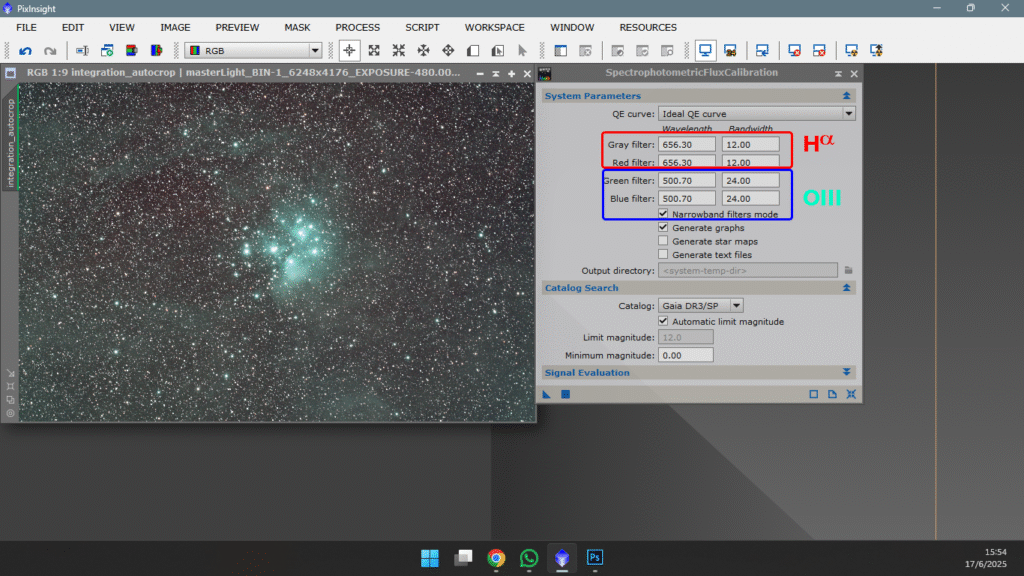
If we wanted to do it manually, we would simply select the Narrow band filters mode and manually enter the corresponding values in the appropriate places. Since I used an Optolong L-eNhance dual band filter, I have to enter the wavelength values and the bandwidth in nanometers as specified by the manufacturer. Since we don’t have a pure luminance channel, we’ll use the farther of the two we have, which is Ha, and according to the manufacturer, it is 656.3 wl and 10nm for Hydrogen alpha, and 500.7 wl with 24nm bandwidth for Oxygen III.
So that’s what we input—the Ha data will be used for L and G, and since we don’t have another bandwidth, the OIII will be used for G and B, like this:
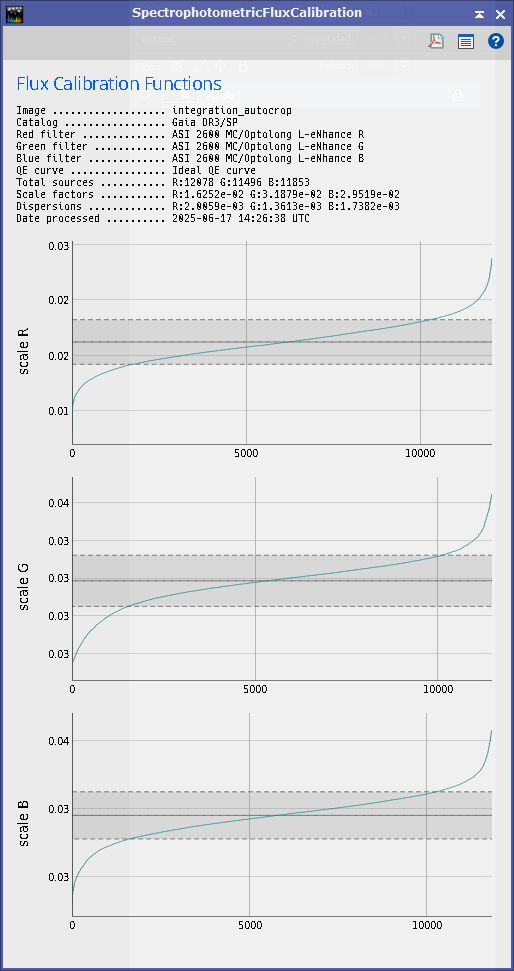
Remember that we’re not calibrating the color, only the total light flux of the image. Once we press Ok, it will show us the global brightness graphs for each channel. This is the graph using narrowband mode and entering the values of each channel according to the Optolong L-eNhance filter properties.
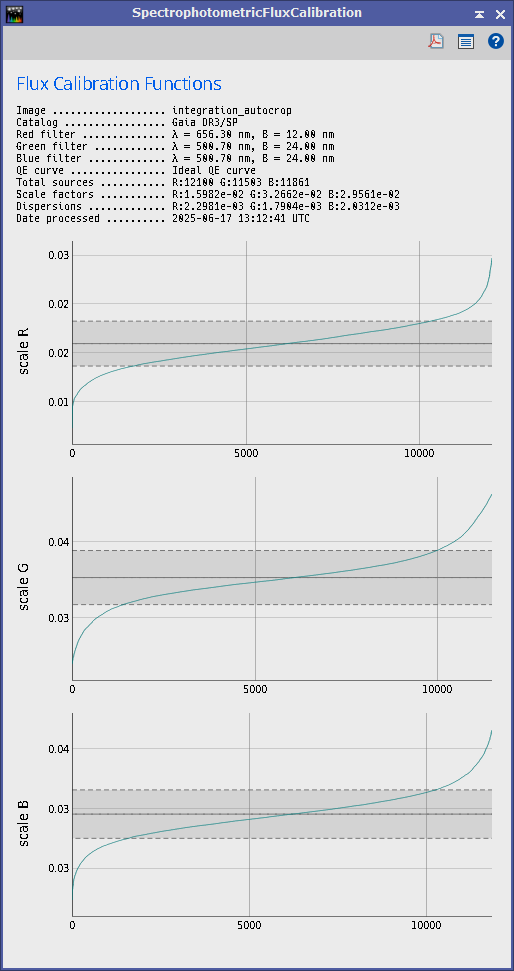
What we are seeing is the calibration of the total light flux of each channel—the gray area is what we’ll call the normal brightness of that particular field, compared with what the GAIA DR3/SP catalog says. Therefore, the parts of the curve that take a sigma shape above and below are outlier values, but perfectly normal—they could be variable stars, misidentified stars, etc. But it’s no problem; to calculate the average, the program will only take the central region, the gray region.
Now let’s compare the flux calibration with the other method—the normal one, without activating narrowband mode.
And the graph:
They are practically the same.
Remember that what this tool does is gather information to later be used in MGC MultiscaleGradientCorrection and in SPCC SpectroPhotometricColorCalibration. Physically, it does nothing to the photo—it simply adds metadata to the image header.
See you soon!!